One super-easy way to get details on your numerical data is a Google Sheets feature called Column Stats. This lets you analyze the data in a column and receive quick statistics for it. If this is a feature you haven’t heard of or tried yet, groovyPost is here help you use Column Stats in Google Sheets.
Why Use Columns Stats in Google Sheets?
The answer to this question is simple, to get statistics on the data in your column quickly. You don’t have to worry about using formulas, inserting rows for column totals, or eyeballing how many times you see the same value. Columns Stats in Google Sheets gives you this kind of information in a couple of clicks. So, not only does the feature save you time by providing faster data analysis but reduces the risk of errors by gathering statistics for you.
Access Column Stats in Your Sheet
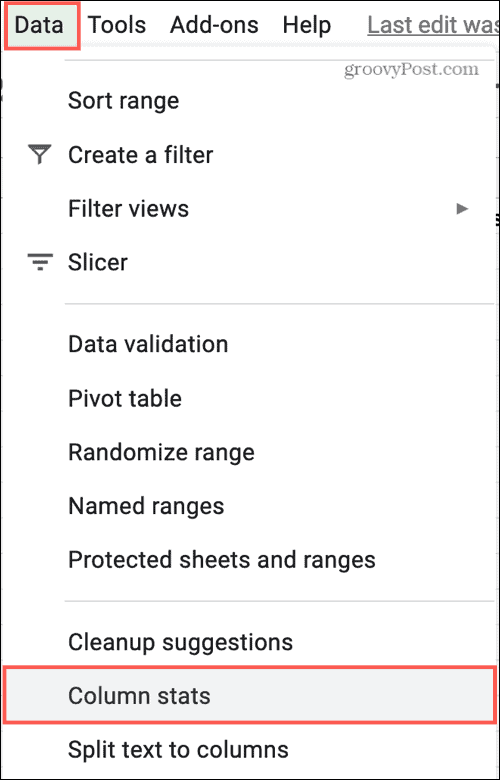
Column Stats is similar to other features in Google Sheets like conditional formatting – once you access it, you’ll see a sidebar that you can keep open and use for other data in your sheet. Select the column in your sheet you want to use to get started and click Data > Column Stats. Alternatively, right-click the column or click the arrow next to the header letter and pick Column Stats.
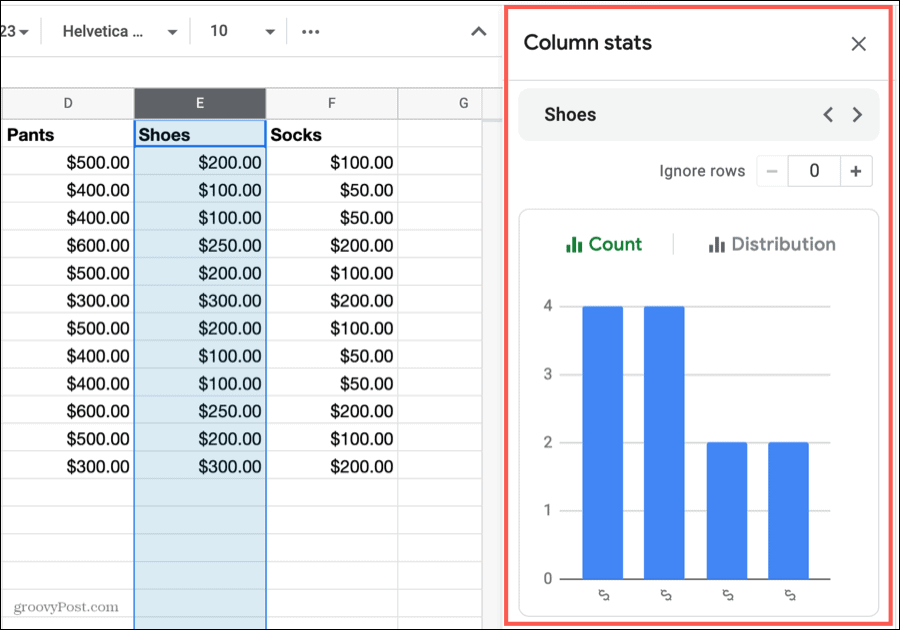
And there’s that handy sidebar on the right of your sheet! You can keep it open and select other columns in your sheet or get stats for columns on different sheets in your workbook. When you finish using Column Stats, just click the X in the sidebar to close it.
Analyze Data With Column Stats
You might be surprised at the amount and types of details you see in Column Stats. To make this how-to a bit easier, we’ll walk through the details in the Column Stats sidebar from top to bottom. Column selector: You can move between the columns in your sheet using this field at the top of the sidebar. If you have column headers, you’ll see those names. If not, you’ll see the column letters. Use the arrows to move between the columns. Ignore rows: Use this convenient tool for eliminating data in the statistics starting at row 1. Enter a number or use the plus and minus signs to ignore that range of rows in your sheet. For instance, if you want to eliminate rows 1 through 5 in the stats, enter 5. You cannot specify a particular row to ignore. If you use the plus and minus signs, you’ll see the rows that you ignore “un-highlight” as you click those buttons. And with that, the statistics change to ignore them instantly.
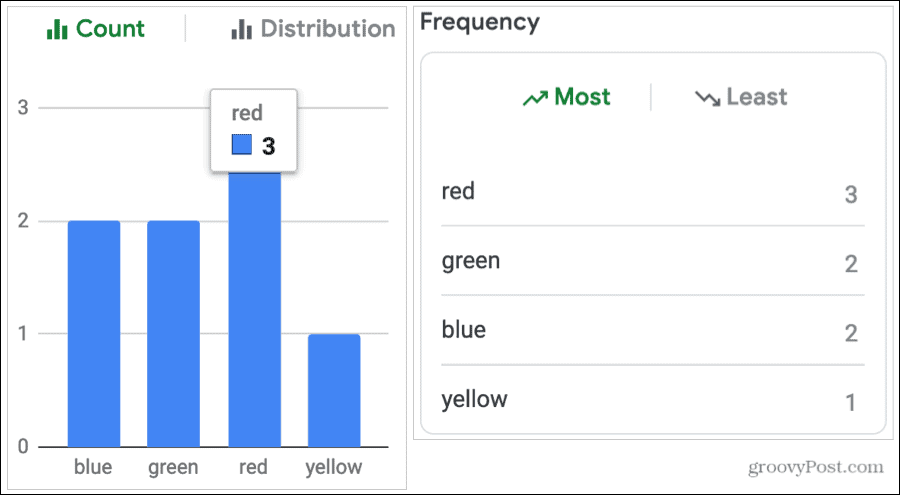
Count and Distribution: This nifty bar graph shows you the number of times a value appears in the column (Count) and how the values are distributed (Distribution). Select one of those options to view the graph and put your cursor over a bar in the graph for the details.
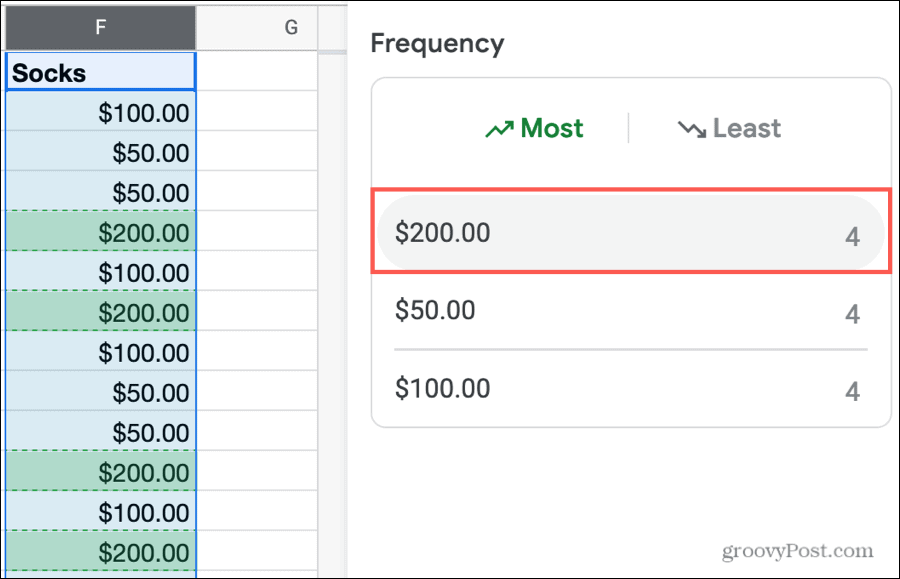
Frequency: See how often a value appears in the column (same as Count, above) sorted by either Most or Least. A bonus for this section is that when you hover your cursor over an item, you’ll see all occurrences highlighted in the column.
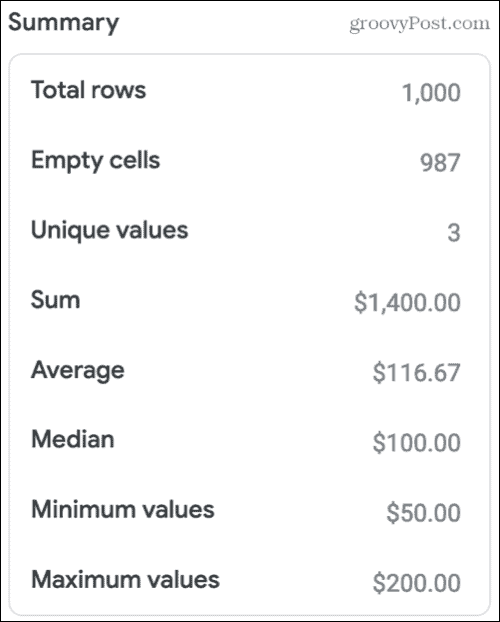
Summary: The final section in the sidebar is a wealth of information. You’ll see the total number of rows in your column and the number of empty cells it contains. You can also review the number of unique values, sum, average, median, minimum, and maximum values.
Keep in mind that the summary changes depending on the type of data in your column. And, you can use the Column Stats for textual data as well as numbers. For example, if you have a product sheet and are reviewing colors available, but you won’t have things like sum, average, or median in the Summary.
Use Column Stats for Text
While the Column Stats feature is awesome for working with numbers, it’s quite useful for text in your sheets too. With the product sheet example above, you can easily use the Counts and Frequency sections to see how many people ordered the color red, for instance.
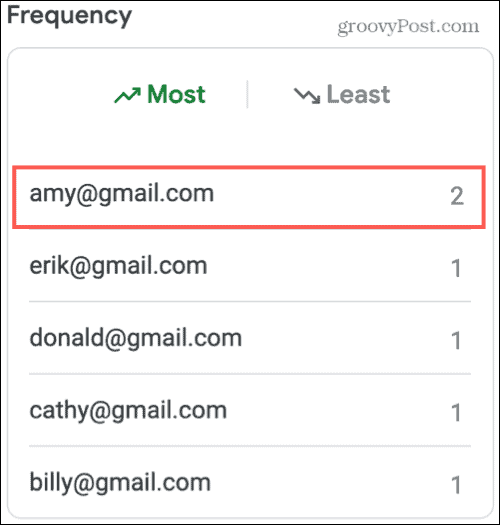
Another terrific use is spotting duplicates in your sheet. You may have a column of email addresses for your customers. Use the Frequency section and sort by Most. If there’s more than one of the exact same email address in that column, you’ll see it at a glance.
Using Google Sheets for tracking your students’ grades? You can use Count or Frequency to quickly see how many students earned each grade on a quiz or assignment, A, B, C, and so on.
There are plenty of uses for Column Stats in Google Sheets for both numbers and text.
Notes on Column Stats
As you begin using this excellent feature in Google Sheets, here are a few notes to consider as you analyze your data with it.
Hidden and filtered rows are included in the Column Stats details. If you see data in the Column Stats that seems odd, check for hidden rows.Header and footer rows are also included. This is important when reviewing Summary items like unique values, sum, average, and other calculated amounts. Remember, you can use the Ignore rows option to exclude a header row from the stats.
Get Quick Details With Google Sheets Column Stats
If you need information for your data at a glance, whether the sum of a column or the number of times a value appears in it, Column Stats in Google Sheets is an excellent tool. And for those times when you do need to use functions, check out our how-tos for using COUNTIF and VLOOKUP in Google Sheets.


![]()
